| If you like Xdebug, please consider a donation. |
- Create a new JSP Project called jsp-php.
Give it a site folder called /webroot. - Give it an index.html file and run the site up to see if it works. (which it should).
- Now create it a file (& folder) called /jsp/default.jsp which should have some thing like:
<%@ page language="java" contentType="text/html; charset=ISO-8859-1"
pageEncoding="ISO-8859-1"
import="java.util.Date"
%>
<!DOCTYPE html PUBLIC "-//W3C//DTD HTML 4.01 Transitional//EN" "http://www.w3.org/TR/html4/loose.dtd">
<html>
<head>
<meta http-equiv="Content-Type" content="text/html; charset=ISO-8859-1">
<link href='http://fonts.googleapis.com/css?family=Cuprum' rel='stylesheet' type='text/css'>
<link href="../basic.css" rel="stylesheet" type="text/css" media="screen" />
<title>Insert title here</title>
</head>
<body>
<h1>New JSP Page</h1>
<%
Date now = new Date();
%>
Now = <%=now.toString() %>
</body>
</html>
in it.
Test it to make sure you haven't f****d up Tomcat. - Now create a file (&folder called) /php/index.php which should have something like this:
<!DOCTYPE html PUBLIC "-//W3C//DTD HTML 4.01 Transitional//EN" "http://www.w3.org/TR/html4/loose.dtd">
<html>
<head>
<meta http-equiv="Content-Type" content="text/html; charset=ISO-8859-1">
<link href='http://fonts.googleapis.com/css?family=Cuprum' rel='stylesheet' type='text/css'>
<link href="../basic.css" rel="stylesheet" type="text/css" media="screen" />
<title>Insert title here</title>
</head>
<body>
<h1>New PHP Page</h1>
<p><a href="phpinfo.php">PHP Info</a></p>
<?php
$brush_price = 5;
echo "<table border=\"1\" align=\"center\">";
echo "<tr><th>Quantity</th>";
echo "<th>Price</th></tr>";
for ( $counter = 10; $counter <= 100; $counter += 10) {
echo "<tr><td>";
echo $counter;
echo "</td><td>";
echo $brush_price * $counter;
echo "</td></tr>";
}
echo "</table>";
?>
</body>
</html>
Give it a run and check it works. - Now create a phpinfo.php page.
Browse to it and ensure you have the correct PHP server and ini file in use.
Look out for the Zend logo at the bottom. - Assuming this is fine and JSP & PHP both run now we need to set up debugging.
This is done initially by adding the following options to the top of your php.ini file:
[PHP]
; XDEBUG
zend_extension = C:\development\php\php_5.3.9\ext\php_xdebug-2.1.2-5.3-vc9.dll
; Adding these lines will stop you debugging when calling Eclipse/PHP/Run as php script
xdebug.default_enable=On
xdebug.remote_enable=On
xdebug.remote_host=127.0.0.1
xdebug.remote_port=9000;
xdebug.remote_handler="dbgp";
xdebug.remote_autostart=off
Now it is possible that all these parts need to be in a [xdebug] section but the jury is still out on that one.
Please note that from this point onwards this php.ini is useless for "run as script".
For more on these options go to http://xdebug.org/docs/remote.
Be extra careful with xdebug.remote_host, this is the host where you develop and run your Eclipse, and PHP will try and connect to Eclipse when debugging is enabled.
Also make sure that the zend_extension part was not added automatically by the installation, if it was don't add it again.
If there is any mention of the Zend debugger in you php.ini file, you will have to comment that out.
Restart Tomcat or whatever web server you're using and make sure the Xdebug installation was correct by running a simple PHP script that contains phpinfo() and searching for "xdebug". - Now the tricky part, Eclipse has to be configured to accept debugging sessions from XDebug.

Follow the steps below:
- Open your project in Eclipse(With PDT installed);
- In the main menu select Project->Properties;
- On the left side of the window select "PHP Debug" and then click on "Configure Workspace Settings"
- On the "PHP Debugger" dropdown select Xdebug and click "Apply";
- Click "Configure" to the right of Xdebug in the same window.
- Select Xdebug and click "Configure".
- On the "Accept remote session(JIT)" select "any" and click "OK". This is extremely important and this is where most people get stuck.
That's it, Eclipse is now configured.
Your PHP Preferences should look like this:

Please note the PHP Executable is set.
If it isn't the debugging ISN'T going to work.
If you choose the incorrect debugger, your project might not execute at all or could execute, but not stop at breakpoints.
If nothing appears in your drop list it is probably because Eclipse is attempting to help you.
Only PHP executables that are compatible with your selected PHP Debugger appear in this drop list. Select the correct one and the list populates (/facepalm). - You should be able to invoke debug as... --> PHP Script on any of the scripts.
- Now all we need is to be able to be in control of our debugging sessions.
To do this you have to tell the IDE that you are attempting to connect to it.
The comms works something like this:
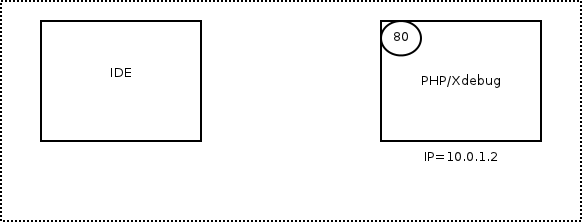
To connect to the IDE/debugger is to add an option to the URL as follows: "http://localhost/jsp-php/php/index.php?XDEBUG_SESSION_STOP_NO_EXEC=ECLIPSE_DBGP&KEY=13275950773634"
The absolutely vital part of this is the ?XDEBUG_SESSION_START=ECLIPSE_DBGP parameter.
An easy (and reliable) way to get this to work if to invoke debug as... --> PHP Web Page. This is by far the best way to proceed as it helps eclipse know which PHP maps to which URL.

Make sure you have [_] Open in Browser un-ticked so that it invokes your default web browser.
When you do so it will show the following to you...

The file I am invoking is phpinfo.php and it appears as http://localhost/jsp-php/webroot/php/phpinfo.php which is not quite right. In this case it is http://localhost/jsp-php/php/phpinfo.php clicking OK will show the script and if you have a break point set then it appears.
I believe this gets round the problem of the path of the file not being what we need it to be.
The URL that appears in the browser is ... http://localhost/jsp-php/php/phpinfo.php?XDEBUG_SESSION_START=ECLIPSE_DBGP&KEY=13282801757752
It is also importat NOT to have two copies of eclipse running at once as they will both be listening on the same port! Obvious when pointed out but that doesn't stop you doing it.
For this we will need to install a Firefox extension called "easy Xdebug"(yes Firefox, you're not developing PHP in IE are you?).
The easiest way to set this up is using a Firefox Plugin called "Easy XDebug".
When installed you will find a little icon on the foot of each page.

But turning it on is not obvious. Go to Firefox;alt;View-->Toolbars-->Addons Toolbar. - Now put a break point in your file.
- Click the little bug icon and refresh the page.
The icon changes as follows:

- Step through the code with coding and variable fun and goodness;
- Click the icon to turn it off.
Please not it won't work for other browsers just the one you are in.


<<Back | Next>>
No comments:
Post a Comment